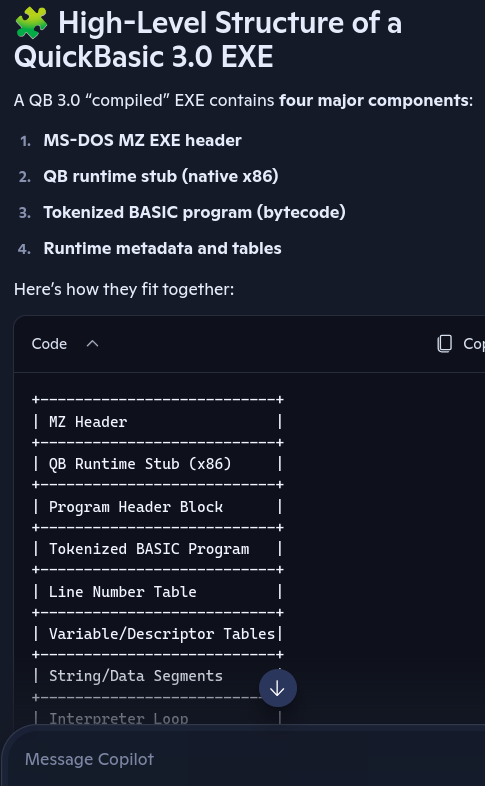
Reverse engineering “Hello World” in QuickBASIC 3.0
Bloat & bytecode from 1987 AD
Intro
How hard can it be, I hear you saying. Difficult to imagine that enough cruft can be added to the titular program for it to become a worthy reverse engineering challenge. But I kid you not: the binary I am going to analyze – here it is – was really created by compiling
10 PRINT "Hello, world!"
and you can have an idea about the amount of effort required by looking at the size of the scrollbar near you1. For who prefers hard numbers, the execution takes about 8000 assembly instructions.
The compiler was QuickBASIC 3.0, QB30 to its friends. Safe to say it was not particularly good at optimizing the binary. Not that we should be overly surprised: BASIC is born to be an interpreted language, and most of its “compilers” just turn the code into an intermediate representation (P-code) and pack a virtual machine alongside it to create an executable. And yet: since this HELLO.EXE already requires us to provide a runtime module (BRUN30.EXE) we might expect the executable itself to be minimal, just carrying the P-code equivalent of the one source code line, plus the runtime loader. But, as it always happens, the devil is in the details, and reconstructing them took many days. Anyway, it was a fun experience, and it might help to enlighten QuickBASIC’s technology for the dozen people in the world that have interest in it.
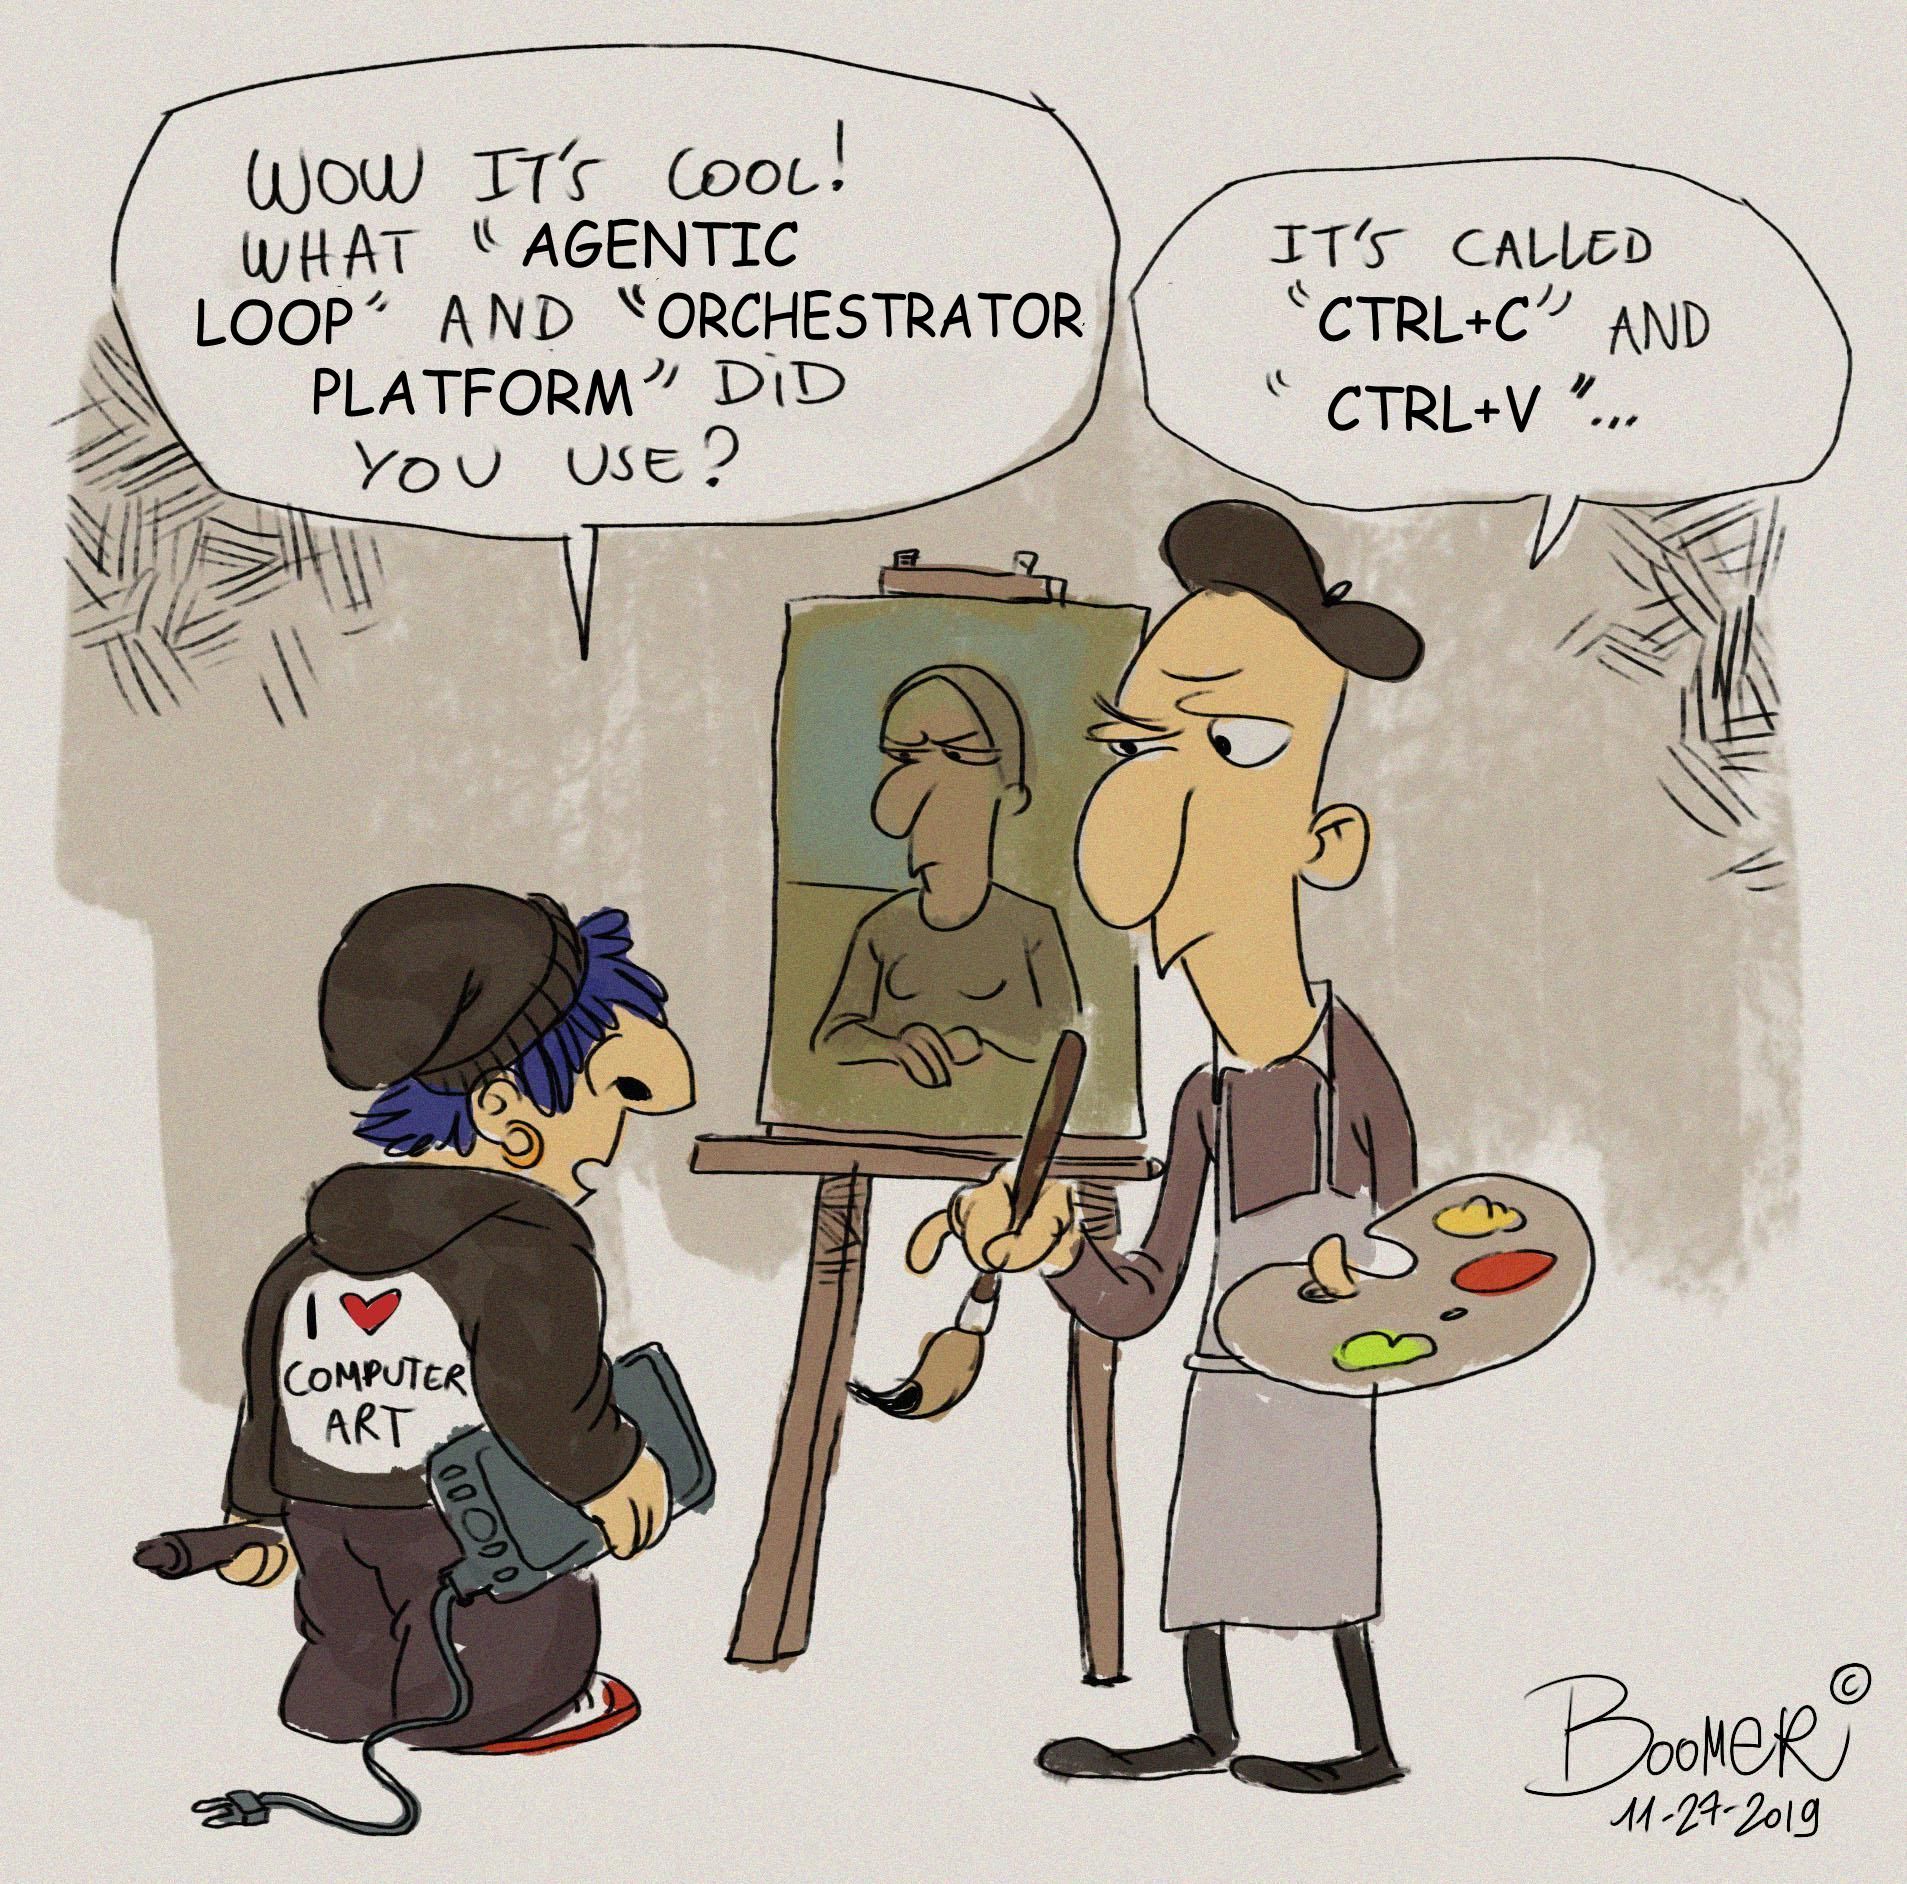
In my previous writeups I tried to combine the technical aspects, the historical notes and the “war story” into something pleasurable to read. This time I feel that the ingredients would not amalgamate well, so I have created more distinctly separated sections. I warmly suggest you to skip anything does not match your taste: if you only want the entertaining parts, check out the comic and then follow to the guided tour. Otherwise, use the TOC to navigate to the sections that pick your curiosity, or jump to the TL;DR. Whatever you choose, I promise that this writeup is entirely out of my pen: I cannot guarantee it will suit your taste, but you’ll not be reading AI slop.
I thank “LowLevelMahn” for his precious help in this project.
Why am I doing this
I’ll pretend not to see the wider meaning of this question. Anyway, last summer I reviewed some barely known DOS games of the CGA era. One of them, Insects, had been apparently lost for more than 30 years, and I made it available for download. I wanted to have a look at its inner workings, but my quick attemps at reversing did not reveal much. The only certain thing was that the game had been compiled with QuickBASIC 3.0, which made things more interesting: maybe, if I managed to understand the program structure, I could use the knowledge to analyze others of the many games produced with this system.
A fellow fan of retro reverse engineering, LowLevelMahn, suggested that I could simplify the task by first analyzing a minimal program compiled in QB30, and kindly offered me a “Hello world” executable to work on. However, my hopes of quickly dissecting this toy example were quickly frustrated: HELLO.EXE managed to crash a couple of well-regarded tools, and when I finally managed to open it, the few functions revealed did not tell much. On top of that, it became quickly clear that not only the program executable needed analysis, but also BRUN30.EXE, the BASIC runtime that it referenced.
It took some months before I could finally tackle the challenge with the necessary energy and equipment, but I am happy to report a success. The effort did not bring new toys to play with like my previous modding projects, but it also came without the frustrations of too many failed attempts.
Checking the literature
Before starting to hack I reviewed what had been written about QuickBASIC and its compilation model, but found not much. The official QB manual is of very good quality as most of the documentation produced by Microsoft in the past century, but it is almost exclusively focused on the source code. I could find just one page that could help me: we will see it later.
Other sources of information were, for various reasons, of little help:
- Microsoft published the source code of some of its earliest products, but nothing pertinent to my quest. The GW-BASIC source code is scarcely useful since it’s only an interpreter. It might possibly help in future to decode the BASIC runtime, but this project had no use for it.
- The most promising resource was a post in Russian language by the blogger “axe_chita”, coincidentally published just some days before the start of my efforts. It is a long post that leads the reader into the secrets of QuickBASIC 4 and its compilation model, all in the form of emotional rant. The comments are also insightful, especially this conversation between the author and “firehacker”, which features a side-by-side comparison between a sample BASIC program and its exe form. Was all of this useful? Not at all! Because, spoiler, QuickBASIC 3 compiles programs in a totally different way than its follower! The post links an article from BYTE magazine that confirms this finding.
- For the same reason, I could not take avail of the BasBolt compiler explorer by Joe Antoon, which mimics the more famous C++ variant by Matt Godbolt and allows to interactively compile a BASIC program via various compilers. Although the readme suggests that QB30 is supported, the source code seems to only expect to use QB40 or QB45 as backends. The critical point is that the system relies on the
/acompiler option, which produces a commented binary but was not yet available in QB30. Pity, but otherwise the project is very interesting! - Also worth noting the QBasic reversing notes by Mauro Meloni. I have not investigated QBasic’s compiled files, but in hindsight the document seems to partially relate to what I saw in my QB30-built executable.
At the end of the day, the only example of successful QB30 hacking I could find was in the documentation of the obscure product Door Patch v3.7, apparently a collection of functions to create “BBS doors” in BASIC. In the readme attached to the archive, programmers Jeff Porter and Clint Labarthe describe how to patch the BRUN30.EXE runtime to make it keep the DTR signal of the serial port always active:
mov al, 1.
It’s always nice to discover these pieces of forgotten knowledge, but these are 3 bytes in a 70 KB executable, so not a big progress…
Toolkit
Emulator
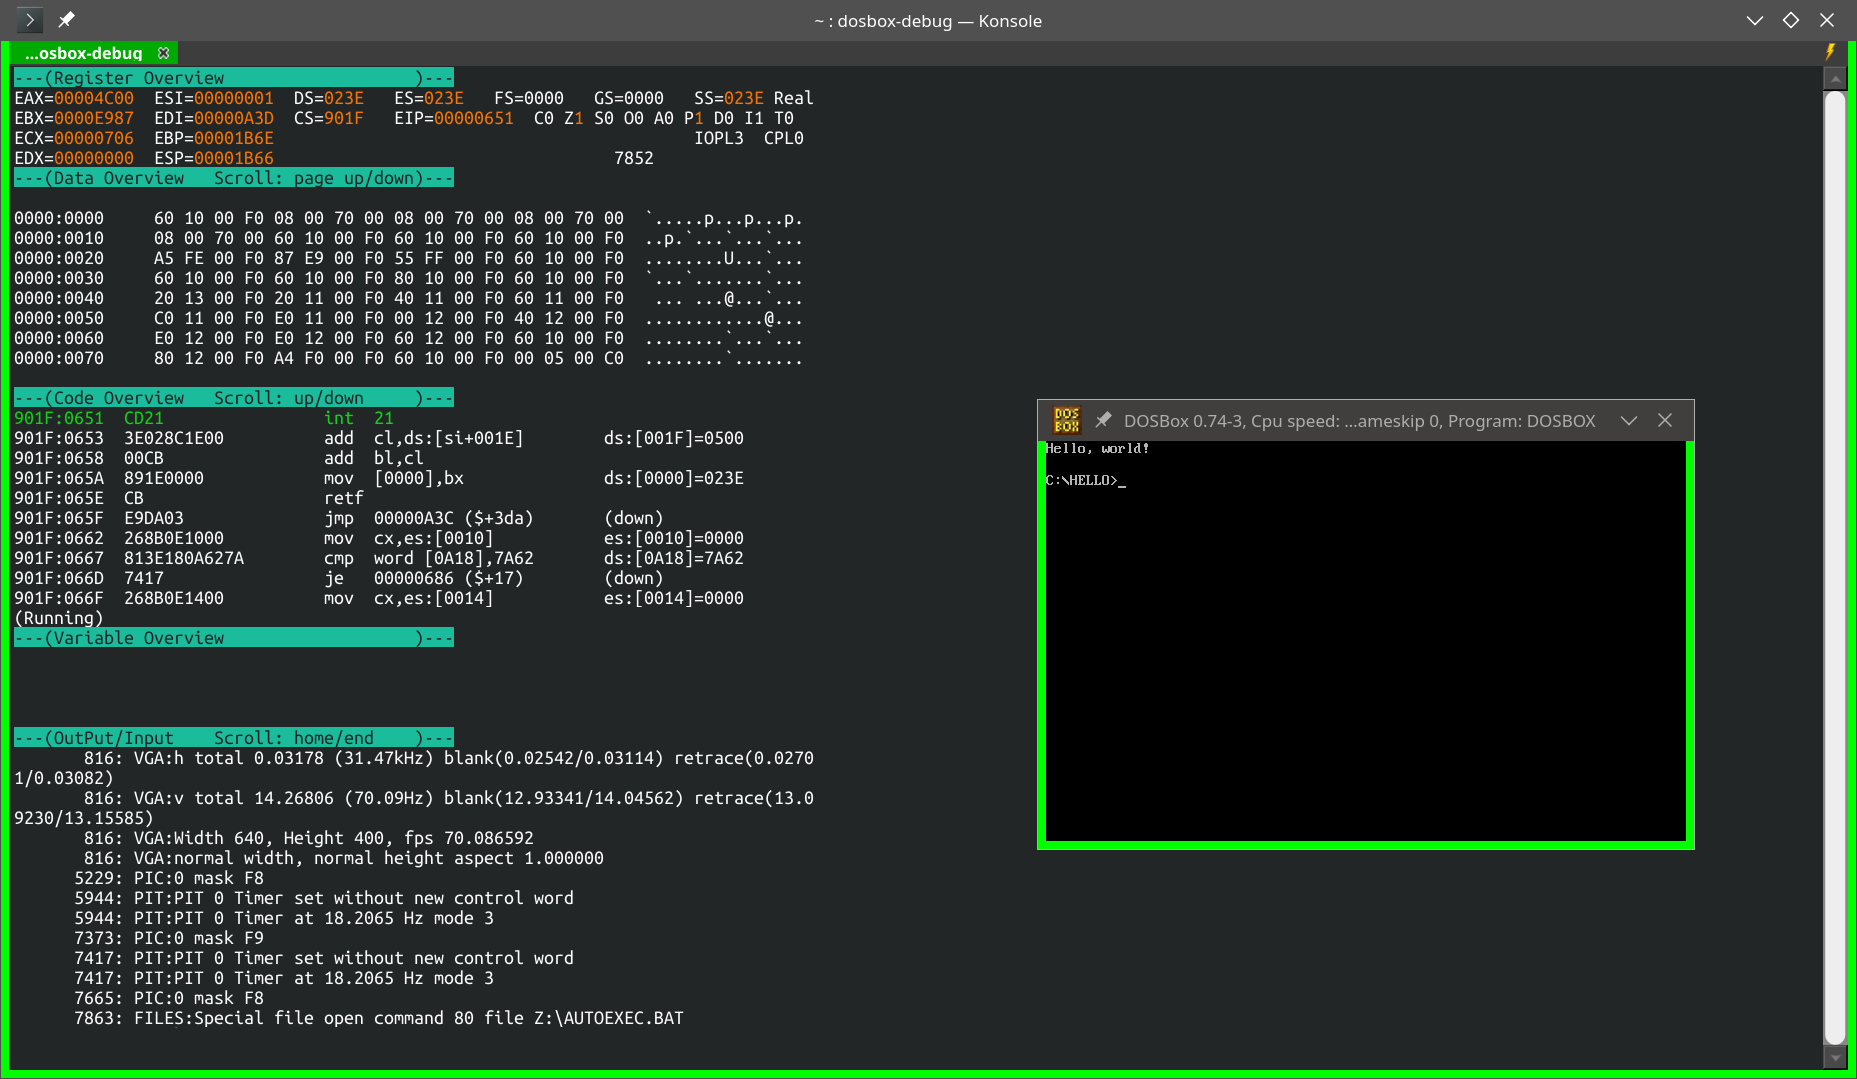
DOSBox Debug is the hero of this story. It was the only tool in my arsenal to digest HELLO.EXE without problems, and its “heavy log” function was a game winner. In future I will probably upgrade to one of the more recent versions (“X” or “Staging”) but for this project the old vanilla DOSBox was enough.
I’d still like to use and document the emulator/debugger Spice86, but the moment was not rife. Instead of debugging HELLO.EXE with the help of Spice86, I ended up doing the inverse, fixing Spice86 to allow it to start HELLO.EXE. Anyway, I recommend to keep a look on this project: the community is very active and it is quickly becoming a valuable tool to analyze old DOS games.
Disassembler
I am not unsatisfied with Ghidra’s functionality, but its UI is not rendering well on Linux, and my aging eyes are increasingly put under stress by its tiny and pixelated Courier New font. There are some workarounds on Github to adjust the pixel density, but they make the text smudged, which I find even worse.
I explored alternatives, and found in radare2 with its GUI Iaito a helpful toolkit for my needs. The user interface is really excellent, mixing the best features of old and new style UX schools. Not so satisfying is the underlying engine: I can accept that segmented x86 is not the main focus of the software, but its extreme instability (crashes, corruption of the project state and other miscellaneous bugs) was unexpected. As much as I want to revive the spirit of the early DOS era, I do not need to recall its worse sides. In any case, after fixing and submitting patches for the worst blockers, and finding workarounds for the lesser annoyances, I was able to get some value back.
LLM
Without the formidable copyright-infringing machine called ChatGPT, this reversing project would have taken maybe 10x more time, or maybe never seen the light of the day. I do not know how this LLM was trained, but it seems to know real-mode x86 assembly in depth, despite the relative scarcity of digitalized books and open-source software for this architecture. ChatGPT’s opinions were almost always pertinent while commenting both the static disassembly and DOSBox’s trace, and thankfully I managed to complete most of the analysis before mid-January, when the number of available messages was reduced.
Still, I am happy that the LLM did not ruin the fun: the risk of hallucinations or false tracks was always present, and I had to correct or ignore some clearly misguided outputs and keep the analysis on a solid track. Also, I quickly gave up on trying to find its sources of knowledge: the model was happy to point me to sites that do not contain the relevant piece of information, to dead links, to made-up sources, to generic “conversations in GitHub”, to a book which has just one surviving copy, located on the third level of the dungeons beneath the Miskatonic University… anywhere, except to something useful. I guess hinting at the archive of pirated books it ingested is not yet considered acceptable.
I tried a couple of alternative products, but came out disappointed.
- Grok seemed promising last summer, but 80% of my attempts were refused because the servers were overloaded.
- As for Copilot, thinking that a Microsoft product could have more information about QuickBASIC was an illusion. All that I got from that LLM were hallucinations, with no base in reality but plausible enough to be convincing. In particular, it kept insisting that the workings of QuickBASIC 3.0 had been reconstructed and widely documented in many sources, offering me fake links and made-up reference tables. Luckily I stopped believing it quickly, otherwise I would have lost my sanity. Other people in the retro reverse engineering seemed to get the same impression from this AI.
Speaking about AI, I constantly feel I am not keeping up with the Jones. In 2024 I was reversing by hand while the cool kids were asking ChatGPT, in 2026 I am copy-pasting text to and from ChatGPT while the cool kids are exploring Codex and quickly moving up in the hierarchy of coding automation. I would claim age is a factor, but my former boss, who started university before I was born, is now giving seminars on how to build a project from scratch using Claude Code. What should I say, boomerism is a state of mind. Let me at least enjoy this passive-aggressive comic:
The DOSBox trace
The first 90% takes 10% of the time
As mentioned previously, most of the insights about HELLO.EXE were produced by quickly running it via DOSBox Debug, after activating the heavy logging. The emulator had no problem to digest the program, and the biggest difficulty, which took one minute at most, was finding a convenient point to break the execution.
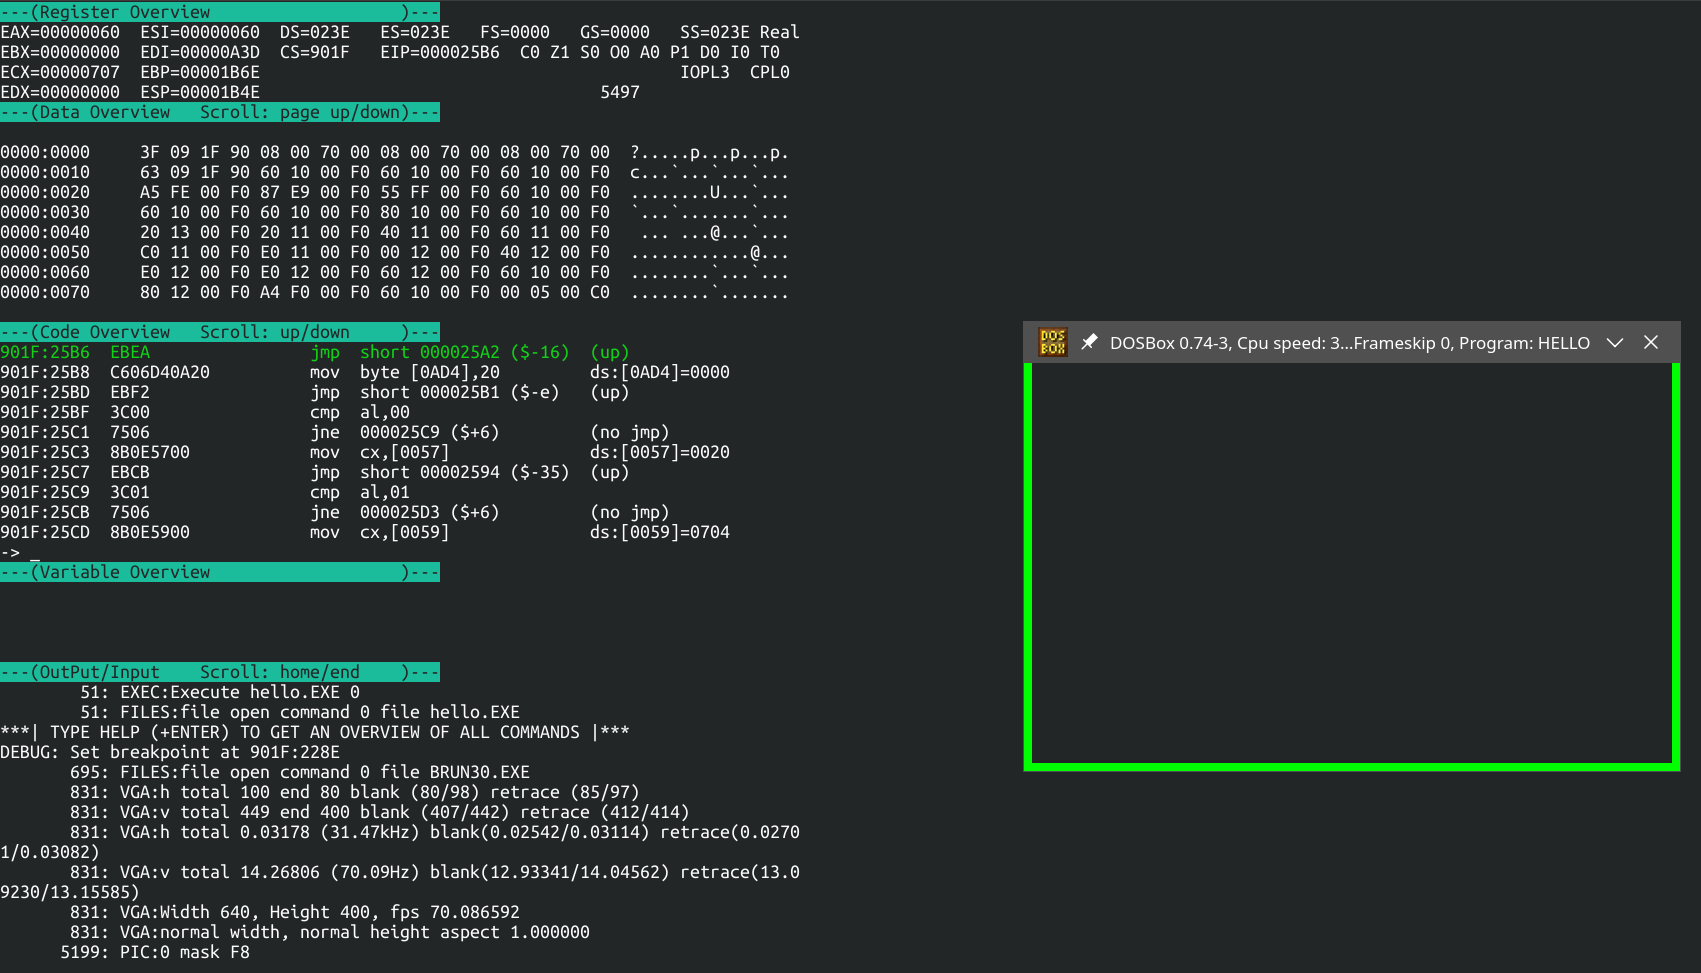
After that, DOSBox produced a trace illustrating the state of all registers and the instruction executed at each cycle2:
0201:0000  jmp  00000099 ($+96)            (down)                 EAX:00000000 EBX:00000000 ECX:000000FF EDX:000001E3 ESI:00000000 EDI:00000BE7 EBP:0000091C ESP:00000BE7 DS:01E3 ES:01E3 FS:0000 GS:0000 SS:0201 CF:0 ZF:0 SF:0 OF:0 AF:0 PF:0 IF:1
0201:0099  mov  dx,ds                                             EAX:00000000 EBX:00000000 ECX:000000FF EDX:000001E3 ESI:00000000 EDI:00000BE7 EBP:0000091C ESP:00000BE7 DS:01E3 ES:01E3 FS:0000 GS:0000 SS:0201 CF:0 ZF:0 SF:0 OF:0 AF:0 PF:0 IF:1
0201:009B  add  dx,0011                                           EAX:00000000 EBX:00000000 ECX:000000FF EDX:000001E3 ESI:00000000 EDI:00000BE7 EBP:0000091C ESP:00000BE7 DS:01E3 ES:01E3 FS:0000 GS:0000 SS:0201 CF:0 ZF:0 SF:0 OF:0 AF:0 PF:0 IF:1
0201:009E  mov  ds,dx                                             EAX:00000000 EBX:00000000 ECX:000000FF EDX:000001F4 ESI:00000000 EDI:00000BE7 EBP:0000091C ESP:00000BE7 DS:01E3 ES:01E3 FS:0000 GS:0000 SS:0201 CF:0 ZF:0 SF:0 OF:0 AF:0 PF:0 IF:1
0201:00A0  mov  ax,[0000]                  ds:[0000]=7A62         EAX:00000000 EBX:00000000 ECX:000000FF EDX:000001F4 ESI:00000000 EDI:00000BE7 EBP:0000091C ESP:00000BE7 DS:01F4 ES:01E3 FS:0000 GS:0000 SS:0201 CF:0 ZF:0 SF:0 OF:0 AF:0 PF:0 IF:1
0201:00A3  push cs                                                EAX:00007A62 EBX:00000000 ECX:000000FF EDX:000001F4 ESI:00000000 EDI:00000BE7 EBP:0000091C ESP:00000BE7 DS:01F4 ES:01E3 FS:0000 GS:0000 SS:0201 CF:0 ZF:0 SF:0 OF:0 AF:0 PF:0 IF:1
0201:00A4  pop  ds                                                EAX:00007A62 EBX:00000000 ECX:000000FF EDX:000001F4 ESI:00000000 EDI:00000BE7 EBP:0000091C ESP:00000BE5 DS:01F4 ES:01E3 FS:0000 GS:0000 SS:0201 CF:0 ZF:0 SF:0 OF:0 AF:0 PF:0 IF:1
0201:00A5  cld                                                    EAX:00007A62 EBX:00000000 ECX:000000FF EDX:000001F4 ESI:00000000 EDI:00000BE7 EBP:0000091C ESP:00000BE7 DS:0201 ES:01E3 FS:0000 GS:0000 SS:0201 CF:0 ZF:0 SF:0 OF:0 AF:0 PF:0 IF:1
The trace consisted of almost 8000 lines: a stunning number for a program printing 13 characters. What was it doing in the rest of the time? Anyway, to make the document more manageable I made some adjustments, adding the line number and removing the high half of the register values, since it could not be touched by 16-bit code:
cat LOGCPU_INT_CD.TXT | awk '{printf "%4d, %s\n", NR, $0}' | sed 's/E\(..:\)0000/\1/g'
I further erased columns (e.g. removing registers FS and GS, not available on 8086 and 8088 CPUs) to compact the view as much as possible. The result looked like this:
   1, 0201:0000  jmp  00000099 ($+96)            (down)                 AX:0000 BX:0000 CX:00FF DX:01E3 SI:0000 DI:0BE7 BP:091C SP:0BE7 DS:01E3 ES:01E3 SS:0201
   2, 0201:0099  mov  dx,ds                                             AX:0000 BX:0000 CX:00FF DX:01E3 SI:0000 DI:0BE7 BP:091C SP:0BE7 DS:01E3 ES:01E3 SS:0201
   3, 0201:009B  add  dx,0011                                           AX:0000 BX:0000 CX:00FF DX:01E3 SI:0000 DI:0BE7 BP:091C SP:0BE7 DS:01E3 ES:01E3 SS:0201
   4, 0201:009E  mov  ds,dx                                             AX:0000 BX:0000 CX:00FF DX:01F4 SI:0000 DI:0BE7 BP:091C SP:0BE7 DS:01E3 ES:01E3 SS:0201
   5, 0201:00A0  mov  ax,[0000]                  ds:[0000]=7A62         AX:0000 BX:0000 CX:00FF DX:01F4 SI:0000 DI:0BE7 BP:091C SP:0BE7 DS:01F4 ES:01E3 SS:0201
   6, 0201:00A3  push cs                                                AX:7A62 BX:0000 CX:00FF DX:01F4 SI:0000 DI:0BE7 BP:091C SP:0BE7 DS:01F4 ES:01E3 SS:0201
   7, 0201:00A4  pop  ds                                                AX:7A62 BX:0000 CX:00FF DX:01F4 SI:0000 DI:0BE7 BP:091C SP:0BE5 DS:01F4 ES:01E3 SS:0201
   8, 0201:00A5  cld                                                    AX:7A62 BX:0000 CX:00FF DX:01F4 SI:0000 DI:0BE7 BP:091C SP:0BE7 DS:0201 ES:01E3 SS:0201
This was my main document for the rest of the analysis. It is really a powerful tool, especially if opened in a good editor. Questions like “when is this constant seen again?” can be answered with one keystroke3, while doubts like “is the other branch of this jz ever taken?” or “which functions of this callback table are called?” can be quickly solved by a judicious use of grep and awk.
Some preliminary findings
My feeling from dissecting DOS programs is that the parts calling interrupts are usually interesting and easy to understand. I was happy to find out that HELLO.EXE calls them often:
$ cat log.csv | wc -l
7905
$ cat log.csv | grep int | wc -l
291
Obviously, the calls are far from appearing regularly. Also, some of the int lines were duplicate due to a bug in DOSBox’s trace algorithm. But even accounting for this, we get a ratio of one interrupt each 45 cycles on average. It’s a promising result.
I created a list of all the interrupt functions called, and looked them up in the HelpPC Reference by David Jurgens. My main curiosity was to find out when and how the characters were sent to the screen. They could also have been printed by directly writing the video memory, but I was hoping that the program used interrupts instead. I was lucky: INT 10,9 was the function used, with the ASCII code of the letter loaded in AL. When did the calls take place?
$ cat log.csv | grep 'int  10       AX:09'

5738, 901F:20D4  int  10       AX:0920 BX:0007 CX:0050 DX:0119 SI:0060 DI:0A3D BP:1B6E SP:1B40 DS:023E ES:023E
6399, 901F:20D4  int  10       AX:0948 BX:0007 CX:0001 DX:0000 SI:185B DI:0A3D BP:1B6E SP:1B40 DS:023E ES:023E
6429, 901F:20D4  int  10       AX:0965 BX:0007 CX:0001 DX:0001 SI:185C DI:0A3D BP:1B6E SP:1B40 DS:023E ES:023E
6459, 901F:20D4  int  10       AX:096C BX:0007 CX:0001 DX:0002 SI:185D DI:0A3D BP:1B6E SP:1B40 DS:023E ES:023E
6489, 901F:20D4  int  10       AX:096C BX:0007 CX:0001 DX:0003 SI:185E DI:0A3D BP:1B6E SP:1B40 DS:023E ES:023E
6519, 901F:20D4  int  10       AX:096F BX:0007 CX:0001 DX:0004 SI:185F DI:0A3D BP:1B6E SP:1B40 DS:023E ES:023E
6549, 901F:20D4  int  10       AX:092C BX:0007 CX:0001 DX:0005 SI:1860 DI:0A3D BP:1B6E SP:1B40 DS:023E ES:023E
6579, 901F:20D4  int  10       AX:0920 BX:0007 CX:0001 DX:0006 SI:1861 DI:0A3D BP:1B6E SP:1B40 DS:023E ES:023E
6609, 901F:20D4  int  10       AX:0977 BX:0007 CX:0001 DX:0007 SI:1862 DI:0A3D BP:1B6E SP:1B40 DS:023E ES:023E
6639, 901F:20D4  int  10       AX:096F BX:0007 CX:0001 DX:0008 SI:1863 DI:0A3D BP:1B6E SP:1B40 DS:023E ES:023E
6669, 901F:20D4  int  10       AX:0972 BX:0007 CX:0001 DX:0009 SI:1864 DI:0A3D BP:1B6E SP:1B40 DS:023E ES:023E
6699, 901F:20D4  int  10       AX:096C BX:0007 CX:0001 DX:000A SI:1865 DI:0A3D BP:1B6E SP:1B40 DS:023E ES:023E
6729, 901F:20D4  int  10       AX:0964 BX:0007 CX:0001 DX:000B SI:1866 DI:0A3D BP:1B6E SP:1B40 DS:023E ES:023E
6759, 901F:20D4  int  10       AX:0921 BX:0007 CX:0001 DX:000C SI:1867 DI:0A3D BP:1B6E SP:1B40 DS:023E ES:023E
7529, 901F:20D4  int  10       AX:0920 BX:0007 CX:0050 DX:0119 SI:0001 DI:0A3D BP:1B6E SP:1B50 DS:023E ES:023E
I already used the adjective “stunning”, but I must repeat it here: the program took 6400 cycles before showing the first letter on the monitor, and additional 30 cycles for each of the following characters!? OK, Electron does worse, but squandering this kind of compute resources in 1987 is unbelievable. If this is how compiled BASIC behaves, is it really faster than the interpreted version?
Speaking of text processing tools, I’ll just mention here another powerful technique. DOSBox Debug allows to dump the RAM content, and with programs running in 640 KB one can just snapshot the whole memory (MEMDUMPBIN 0:0 fffff) at different time points, and process the result with various tools. I especially like to use grep and instantly get an idea of how a certain memory slice evolved. It is useful, for example, to approximately find out when a given byte was written without having to re-run the program. Example:
$ grep 0008fec0 memdump*.txt

memdump-0000.bin.txt:0008fec0  00 00 00 00 00 00 00 00  00 00 00 00 00 00 00 00  |................|
memdump-0748.bin.txt:0008fec0  00 00 00 00 00 00 00 00  00 00 00 00 00 00 00 00  |................|
memdump-2750.bin.txt:0008fec0  00 00 00 00 00 00 00 00  00 00 00 00 00 00 00 00  |................|
memdump-3136.bin.txt:0008fec0  00 00 00 00 00 00 00 00  00 00 00 00 00 00 00 00  |................|
memdump-3431.bin.txt:0008fec0  00 00 00 00 00 00 00 00  00 00 00 00 00 00 00 00  |................|
memdump-4075.bin.txt:0008fec0  4d 00 00 31 00 03 00 00  00 00 00 80 00 00 00 00  |M..1............|
memdump-4351.bin.txt:0008fec0  4d e3 01 30 00 03 00 00  48 45 4c 4c 4f 00 00 00  |M..0....HELLO...|
memdump-5851.bin.txt:0008fec0  4d e3 01 30 00 03 00 00  48 45 4c 4c 4f 00 00 00  |M..0....HELLO...|
memdump-6153.bin.txt:0008fec0  4d e3 01 30 00 03 00 00  48 45 4c 4c 4f 00 00 00  |M..0....HELLO...|
Checking the disassembly
I wanted to combine the analysis of the execution trace with the study of the disassembly, but I was up for disappointments. To start with, neither Ghidra nor radare2 were initially able to open HELLO.EXE. I would have been blocked by this for a long time, were it not for a vital hint from the Spice86 community:
The exe-size is smaller than the [MZ] header states:
file-size: 0xCD0 (3280) bytes, exe-size-from-header: 0xD60 (3424) bytes
This observation referred to the game INSECTS.EXE, and I thought this was a sign that the game image had been tampered with. But when I cheched the MZ header of HELLO.EXE, I found the same problem: the header declares an image size bigger than what the exe contains, and apparently Ghidra, radare2 and Spice86 trust it blindly, resulting into a segfault. Is this a bug in the QB compiler or a forgotten feature? In any case, DOSBox seems aware of such cases and handles them gracefully, so I patched Spice86 and radare2 correspondingly.
After opening the disassembly, another bad surprise: Ghidra found the very same functions in “Hello world” and Insects.
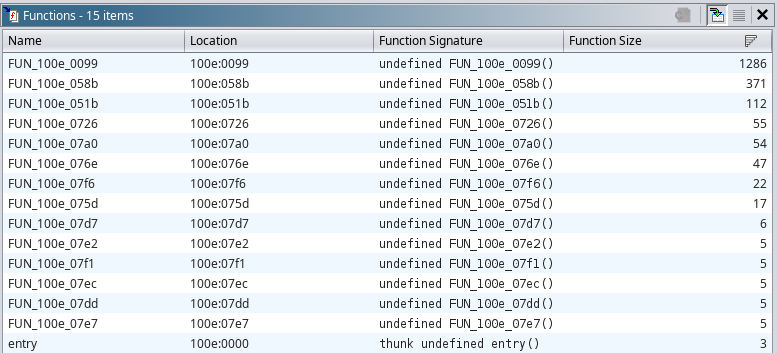
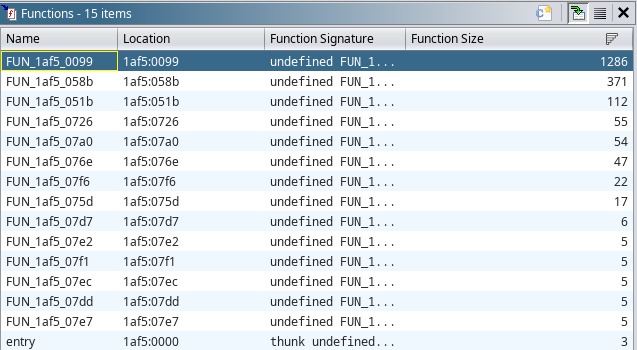
HELLO.EXE; right: INSECTS.EXE.
radare2 found more functions, but they did not seem to make sense and were probably misinterpreted data zones. Either the compiled BASIC code was not stored in executable form – maybe in P-code? – or it was reached through some jumps that the analyzers could not follow. We’ll find out later that, somehow, both things are true.
Following the trace, part 1: the BRUN loader
With the disassemblers out of play, it was time to return to the trace. With grep and awk we could already find out interesting facts, but for the complete picture we must go the long way: examine the trace cycle by cycle and reconstruct the intent behind each intruction. You can download the trace here and follow along, or just read my summary.
Introductory steps
The program starts with
1, 0201:0000 jmp 00000099 AX:0000 BX:0000 CX:00FF DX:01E3 SI:0000 DI:0BE7 BP:091C SP:0BE7 DS:01E3 ES:01E3 SS:0201
which should already raise some eyebrows. The program skips over 0x99 bytes at the start of the CS segment, but the reason for that will only be revealed after some acts, like Chekhov’s gun. For now, let’s follow the instruction pointer and see the next lines, which set the tone of the play:
 2, 0201:0099  mov  dx,ds       AX:0000 BX:0000 CX:00FF DX:01E3 SI:0000 DI:0BE7 BP:091C SP:0BE7 DS:01E3 ES:01E3
 3, 0201:009B  add  dx,0011     AX:0000 BX:0000 CX:00FF DX:01E3 SI:0000 DI:0BE7 BP:091C SP:0BE7 DS:01E3 ES:01E3
 4, 0201:009E  mov  ds,dx       AX:0000 BX:0000 CX:00FF DX:01F4 SI:0000 DI:0BE7 BP:091C SP:0BE7 DS:01E3 ES:01E3
 5, 0201:00A0  mov  ax,[0000]   AX:0000 BX:0000 CX:00FF DX:01F4 SI:0000 DI:0BE7 BP:091C SP:0BE7 DS:01F4 ES:01E3
 6, 0201:00A3  push cs          AX:7A62 BX:0000 CX:00FF DX:01F4 SI:0000 DI:0BE7 BP:091C SP:0BE7 DS:01F4 ES:01E3
 7, 0201:00A4  pop  ds          AX:7A62 BX:0000 CX:00FF DX:01F4 SI:0000 DI:0BE7 BP:091C SP:0BE5 DS:01F4 ES:01E3
 8, 0201:00A5  cld              AX:7A62 BX:0000 CX:00FF DX:01F4 SI:0000 DI:0BE7 BP:091C SP:0BE7 DS:0201 ES:01E3
 9, 0201:00A6  cmp  ax,7A62     AX:7A62 BX:0000 CX:00FF DX:01F4 SI:0000 DI:0BE7 BP:091C SP:0BE7 DS:0201 ES:01E3
10, 0201:00A9  je   000000AE    AX:7A62 BX:0000 CX:00FF DX:01F4 SI:0000 DI:0BE7 BP:091C SP:0BE7 DS:0201 ES:01E3
This is an integrity test, looking for the magic bz at offset DS:0110. But it also mangles the DS register instead of simply setting an offset. Not happy with that, the program goes on by changing DS again immediately after, setting it equal to CS. Hope you like segmented architecture, because the data segment register is going into a lot of pilgrimages:
$ grep -P 'DS:....' --only-matching log.csv | sort | uniq | wc -l
28
But let’s not think about that for now. The program follows with a DOS version check.
  11, 0201:00AE  mov  ah,30        AX:7A62 BX:0000 CX:00FF DX:01F4 SI:0000 DI:0BE7 BP:091C SP:0BE7 DS:0201 ES:01E3
  12, 0201:00B0  int  21           AX:3062 BX:0000 CX:00FF DX:01F4 SI:0000 DI:0BE7 BP:091C SP:0BE7 DS:0201 ES:01E3
  13, 0201:00B0  int  21           AX:3062 BX:0000 CX:00FF DX:01F4 SI:0000 DI:0BE7 BP:091C SP:0BE7 DS:0201 ES:01E3
  14, F000:14C0  sti               AX:3062 BX:0000 CX:00FF DX:01F4 SI:0000 DI:0BE7 BP:091C SP:0BE1 DS:0201 ES:01E3
  15, F000:14C1  callback 0026     AX:3062 BX:0000 CX:00FF DX:01F4 SI:0000 DI:0BE7 BP:091C SP:0BE1 DS:0201 ES:01E3
  16, F000:14C5  iret              AX:0005 BX:0000 CX:0000 DX:01F4 SI:0000 DI:0BE7 BP:091C SP:0BE1 DS:0201 ES:01E3
  17, 0201:00B2  cmp  al,02        AX:0005 BX:0000 CX:0000 DX:01F4 SI:0000 DI:0BE7 BP:091C SP:0BE7 DS:0201 ES:01E3
  18, 0201:00B4  jnc  000000B9     AX:0005 BX:0000 CX:0000 DX:01F4 SI:0000 DI:0BE7 BP:091C SP:0BE7 DS:0201 ES:01E3
Thus ends the easy part. Now our “Hello world” decides to become a mini-OS, and to repartition the available memory. In cycles 34–144, it creates three memory areas, each one marked by a header, of size 0x20, 0x10, 0x1000 paragraphs respectively.
After this (cycles 145–546), the program copies the environment variables in a space after the last of the three newly defined regions, and marks such space with a new “memory region” header. Note the interesting order of these operations: in the protected mode era one should first scan the length of the source text, then allocate the memory and finally copy the bytes. Our program, instead, first copies the bytes and then, knowing the space needed, defines the size of the surrounding memory area in hindsight, by just writing an appropriate header.
As if this abuse of the freedoms of the DOS era were not sufficient, the program doubles down, creating yet another memory block header at CS:0000. It overwrites its own initial jmp and fences the mysterious 0x99 bytes it had skipped previously. Don’t worry, we’ll find out about them later.
Let’s take a breath and have a look at the state of the RAM at cycle 635. We have now five memory block headers:
00002010  0a 00 09 00 90 00 00 00  00 00 01 00 00 00 00 00  |................|
00002c00  01 00 20 00 00 02 00 00  00 00 01 00 00 00 00 00  |.. .............|
00002e10  02 00 10 00 00 01 00 00  00 00 01 00 00 00 00 00  |................|
00002f20  06 00 00 10 00 00 01 00  00 00 01 00 00 00 00 00  |................|
00012f30  07 00 07 00 70 00 00 00  00 00 00 00 00 00 00 00  |....p...........|
          ^^^^^ ^^^^^ ^^^^^^^^^^^        ^^^^^
           (A)   (B)      (C)             (D)
The fields at B and C are the size in paragraphs and bytes, excluding the space taken by the header itself. The other fields are harder to interpret, but the following suggests that (A) is the ID of the region, while (D) is a bitfield.
Loading BRUN30
How to take avail of the routines offered by the BASIC runtime, in an era where dynamic linking is still to come? HELLO.EXE does this by hand. It opens BRUN30.EXE and copies chunks of it in the memory. If BRUN30 is not found in the current directory, the %PATH% environment variable is also taken into account.
The first two loads, at cycles 653 and 685, are just a handful of bytes, less than 30 bytes each. They are used to verify BRUN’s file format and its version (5.6). More importantly, one of the fragments contains BRUN’s code size (0x0FE0 paragraphs).
Instead of creating a memory block for BRUN in the autharchic way used for the previous chunks, HELLO.EXE uses interrupt 0x21 to deferentially request memory from DOS. Since HELLO already owns the whole memory, a slice must be cut out and returned to the OS…
; INT 21,4A: Modify allocated memory block
; BX = new size in paragraphs = 9FFF - 0FE0 (from BRUN) - 1 - 01E3 (starting DS) = 8E3B
; ES = segment of the block (MCB + 1 para)

718, 0201:078C  int  21   AX:4A3B BX:8E3B CX:0000 DX:0FE1 SI:092A DI:0010 BP:091C SP:0BE5 DS:0201 ES:01E3
…and then immediately requested back, but as separate block:
; INT 21,48: Allocate memory
; BX = number of paragraphs requested

727, 0201:0798  int  21   AX:48E3 BX:0FE0 CX:0000 DX:0FE0 SI:092A DI:0010 BP:091C SP:0BE5 DS:0201 ES:01E3
So instead of one block extending from CS:0000 to the end of the conventional memory, we have now a slightly smaller block still starting from CS:0000, and a new one starting from segment 901F. In the second one, at cycle 750, land the first 64 KByte of BRUN30.EXE, except for the first 0x200 bytes that do not contain executable code and are skipped.
The remaining 5 KBytes of BRUN30.EXE probably represent data, since they are read separately (cycle 781) into the data segment.
I see you skeptical, dear reader. “How are we going to run the BRUN30 code? Memmapping the binary is not going to produce anything executable; the pointers will be all wrong, because DOS was not asked to fixup them”. But here is the catch: HELLO.EXE is taking its job as mini-operating system seriously. It does not need to request DOS to do the low-level operations: it does them itself.
And so, cycles 827–2750 are dedicated to scanning BRUN’s relocation table and adjusting the pointers accordingly. This operation, indeed a very normal thing for a Hello World program to do, occupies 25% of the execution trace.
If you made it till here, congratulations! Here’s some eye candy before we proceed: a radiography of how the memory is looking like, with the landmarks defined till now.

Made by the beautiful binvis.io tool by Aldo Cortesi.
The long farewell
Are we now ready to start the BASIC code? Far from it! First (cycles 2762–2979) yet another memory block is defined, this time at 12FB:0000:
00012fb0  09 00 00 00 00 00 00 00  00 00 00 80 00 00 00 00  |................|
          ^^^^^ ^^^^^ ^^^^^^^^^^^        ^^^^^
           (A)   (B)      (C)             (D)
This block is, I think (ChatGPT does not agree), just used to mark the unused RAM. Note that the (D) field is marked with 0x8000; this will get the block special treatment in the following.
Aftwerwards (cycles 2798–2813) the command line arguments are copied into the memory block at segment 02E1. We launched HELLO.EXE without parameters, so nothing is done.
Cycles 2815–2895… not sure about those. Some other values are written inside the memory block containing the command line, and other bytes (internal pointers?) of the data part are adjusted.
But now we are approaching the big jump and, as it always happens just before a long journey, the preparations get frantic. Lots of registers are overwritten with segment values:
2898, 0201:04E7  mov  bp,[094F]    ds:[094F]=901E   AX:0020 BX:003A CX:0000 DX:0000 SI:000A DI:0016 BP:901F SP:0BE7 DS:0201 ES:02E2
2899, 0201:04EB  mov  dx,[0941]    ds:[0941]=023E   AX:0019 BX:003A CX:0000 DX:0000 SI:000A DI:0016 BP:901E SP:0BE7 DS:0201 ES:02E2
2900, 0201:04EF  mov  si,[0935]    ds:[0935]=901F   AX:0019 BX:003A CX:0000 DX:023E SI:000A DI:0016 BP:901E SP:0BE7 DS:0201 ES:02E2
2901, 0201:04F3  mov  di,[0945]    ds:[0945]=01F3   AX:0019 BX:003A CX:0000 DX:023E SI:901F DI:0016 BP:901E SP:0BE7 DS:0201 ES:02E2
2902, 0201:04F7  mov  ax,[0947]    ds:[0947]=020B   AX:0019 BX:003A CX:0000 DX:023E SI:901F DI:01F3 BP:901E SP:0BE7 DS:0201 ES:02E2
2903, 0201:04FA  mov  es,ax                         AX:020B BX:003A CX:0000 DX:023E SI:901F DI:01F3 BP:901E SP:0BE7 DS:0201 ES:02E2
2904, 0201:04FC  mov  ax,bp                         AX:020B BX:003A CX:0000 DX:023E SI:901F DI:01F3 BP:901E SP:0BE7 DS:0201 ES:020B
2905, 0201:04FE  sub  ax,0020                       AX:901E BX:003A CX:0000 DX:023E SI:901F DI:01F3 BP:901E SP:0BE7 DS:0201 ES:020B
Then even the stack is replaced:
2906, 0201:0501  cli             AX:8FFE BX:003A CX:0000 DX:023E SI:901F DI:01F3 BP:901E SP:0BE7 DS:0201 ES:020B SS:0201
2907, 0201:0502  mov  ss,ax      AX:8FFE BX:003A CX:0000 DX:023E SI:901F DI:01F3 BP:901E SP:0BE7 DS:0201 ES:020B SS:0201
2908, 0201:0504  mov  sp,0200    AX:8FFE BX:003A CX:0000 DX:023E SI:901F DI:01F3 BP:901E SP:0BE7 DS:0201 ES:020B SS:8FFE
2909, 0201:0507  sti             AX:8FFE BX:003A CX:0000 DX:023E SI:901F DI:01F3 BP:901E SP:0200 DS:0201 ES:020B SS:8FFE
And after other shenanigans with the registers, the instruction pointer jumps back, in those mysterious 0x99 bytes that were skipped at the very start of the execution. Talk about “spaghetti coding”!
2916, 0201:0518 jmp 00000016 AX:02C0 BX:01E3 CX:103C DX:023E SI:901F DI:01F3 BP:901E SP:0200 DS:02C0 ES:020B
What does this short block does? The answer is here:
2930, 0201:002F repe movsw AX:02C0 BX:103C CX:7FF8 DX:023E SI:0000 DI:0000 BP:901E SP:01F8 DS:02C0 ES:020B
A single instruction, but doing a lot of work. It copies 0x7FF8 bytes (almost 32 KB) of data from 02C0:0000 to 020B:0000, i.e. CS:00A0. In other words, it overwrites the whole code of HELLO.EXE (!) by pulling back the data regions created in the previous phases. Only those 0x99 bytes that we are currently running are spared. That’s why the execution started with a jmp: to skip over this stub which must be executed last, but must appear early, to avoid being overwritten by the copy. “Hello world” might be inefficient with its CPU usage, but it is really set on using as little memory as possible!
Cycles 2917–3135 are taken by the large copy operation. Let’s look at the resulting state of the memory, and compare it to the previous snapshot.

The amount of space freed by the self-immolation of `HELLO.EXE`, 2896 bytes, is exaggerated in the picture. But QuickBASIC could work with as low as 256 KB of memory, part of which was used by DOS and other system components. One can easily see how every byte spared could make a difference.
The tiny surviving stub of HELLO.EXE has not yet finished. First (cycles 3136–3257) it performs a linear search in the memory regions previously defined, using the size information stored in their headers to iterate through them like a linked list. It looks for the regions having two particular IDs (1 and 2), saving their segments in BX and ES.
The stub then sets a new stack:
3267, 0201:007D  cli           AX:1B68 BX:020B CX:000A DX:01E3 SI:901F DI:01F3 BP:901E SP:0200 DS:023E ES:022D SS:8FFE
3268, 0201:007E  mov  sp,ax    AX:1B68 BX:020B CX:000A DX:01E3 SI:901F DI:01F3 BP:901E SP:0200 DS:023E ES:022D SS:8FFE
3269, 0201:0080  mov  ax,ds    AX:1B68 BX:020B CX:000A DX:01E3 SI:901F DI:01F3 BP:901E SP:1B68 DS:023E ES:022D SS:8FFE
3270, 0201:0082  mov  ss,ax    AX:023E BX:020B CX:000A DX:01E3 SI:901F DI:01F3 BP:901E SP:1B68 DS:023E ES:022D SS:8FFE
3271, 0201:0084  sti           AX:023E BX:020B CX:000A DX:01E3 SI:901F DI:01F3 BP:901E SP:1B68 DS:023E ES:022D SS:023E
Afterwards it pushes a pointer: 01F4:0030. The segment is with one the bz magic, if you remember, while the offset is hard-coded.
3274, 0201:0088  push di       AX:01F3 BX:020B CX:000A DX:01E3 SI:901F DI:01F4 BP:901E SP:1B68 DS:023E ES:022D
3275, 0201:0089  mov  di,0030  AX:01F3 BX:020B CX:000A DX:01E3 SI:901F DI:01F4 BP:901E SP:1B66 DS:023E ES:022D
3276, 0201:008C  push di       AX:01F3 BX:020B CX:000A DX:01E3 SI:901F DI:0030 BP:901E SP:1B66 DS:023E ES:022D
Then it jumps further back…
3282, 0201:0096 jmp 00000010 AX:01F3 BX:020B CX:000A DX:901E SI:0007 DI:01E3 BP:901E SP:1B60 DS:023E ES:022D
…where it shows its last trick,
3283, 0201:0010 retf AX:01F3 BX:020B CX:000A DX:901E SI:0007 DI:01E3 BP:901E SP:1B60 DS:023E ES:022D
a ret that does not really “return” since there is no call stack, but is used as far jump that lands the control flow…
3284, 901F:0007 jmp short 000B AX:01F3 BX:020B CX:000A DX:901E SI:0007 DI:01E3 BP:901E SP:1B64 DS:023E ES:022D
…into the entry point of BRUN30.EXE! Say goodbye to HELLO.EXE, for we won’t see it for some while.
Following the trace, part 2: into BRUN30
A series of unfortunate boring events
After the jump, we might hope that the antefact is finished and we can soon see the BASIC code being loaded, but no such luck. On the contrary, another long sequence begins spanning cycles 3285–4591, parts of which I cannot clarify. ChatGPT gave its hypotheses, but I am skeptical about some details. The point is that most of the operations are probably needed for various runtime functions that our “Hello, world” program does not use (e.g. dynamically sized strings), so I cannot see how they come into play.
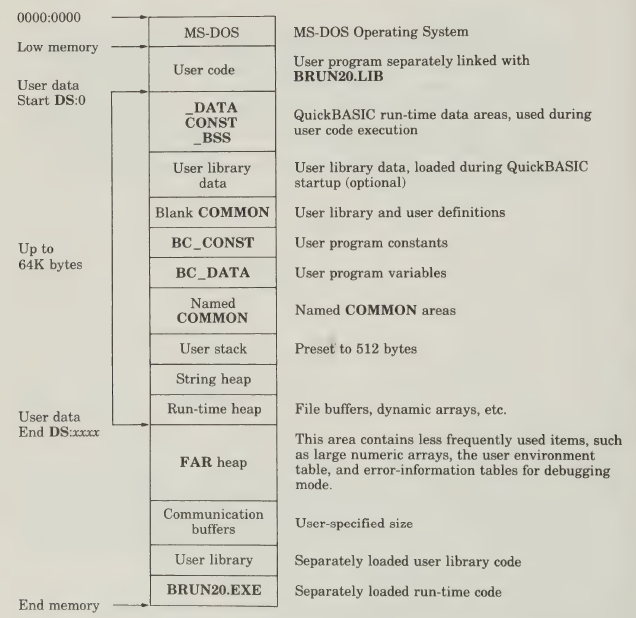
It is maybe the right moment to show the one page of the official QuickBASIC manual that I had mentioned before. It illustrates how the memory is supposed to be configured. However it is not easy to match these regions to the operations the code is performing.
Anyway, this is a quick overview of this section of the trace.
Cycles 3311–3383 create what seems an array of segment pointers at the start of the block at segment 020B.
000020c0  00 00 0b 02 2c 02 00 00  00 00 00 00 3d 02 3e 12  |....,.......=.>.|
000020d0  00 00 00 00 01 02 00 00  00 00 00 00 00 00 00 00  |................|
000020e0  00 00 00 00 00 00 00 00  00 00 f3 01 f8 01 fa 01  |................|
000020f0  fc 01 fe 01 00 00 00 00  00 00 00 00 00 00 00 00  |................|
Cycles 3384–3430 fill in the header of the “unused RAM“ block (created at segment 12FB before the jump, now at 1246), and write its address in the array just created.
00012460  03 00 d7 7d 70 dd 07 00  00 00 00 80 00 00 00 00  |...}p...........|
          ^^^^^ ^^^^^ ^^^^^^^^^^^        ^^^^^
           (A)   (B)      (C)             (D)
Cycles 3457–3895 want to defragment the free space, merging together all blocks whose (D) field has a 0x8000 flag. But since we only have one such block, the net effect is null.
Cycles 3895–4091 are more interesting: they shrink the big “unused RAM” block by 512 bytes at the end. In the resulting space, another memory block is created:
0008fec0  4d 00 00 31 00 03 00 00  00 00 00 80 00 00 00 00
          ^^^^^ ^^^^^ ^^^^^^^^^^^        ^^^^^
           (A)   (B)      (C)             (D)
This header does not last long: a call to int 21,48 (DOS allocate memory) overwrites it with a DOS memory control block:
0008fec0 4d e3 01 30 00 03 00 00 48 45 4c 4c 4f 00 00 00 |M..0....HELLO...|
All for nothing: this slice of memory will stay empty for the rest of the execution. According to the manual page above, it could be the space for an optional user library, but it’s just a guess.
Cycles 4092–4119 are more juicy: they install custom handlers for interrupts 0x3D, 0x3E and 0x3F. Remember this because it’s probably the most important thing done in this phase.
; INT 21,25 - Set Interrupt Vector
;
; AL = interrupt number
; DS:DX = pointer to handler

4099, 901F:0534  int  21    AX:253D BX:0030 CX:0004 DX:0048 SI:901F DI:01E3 BP:901E SP:1B60 DS:901F ES:901F
4106, 901F:053C  int  21    AX:253E BX:0030 CX:0004 DX:00BB SI:901F DI:01E3 BP:901E SP:1B60 DS:901F ES:901F
4113, 901F:0544  int  21    AX:253F BX:0030 CX:0004 DX:00E9 SI:901F DI:01E3 BP:901E SP:1B60 DS:901F ES:901F
Cycles 4120–4548 resume the memory block manipulations. Hopefully you’ll forgive me if I have no in-depth analysis to present here. I’ll just show you a couple of features. First, this enigmatic pair of lines. Developer error? A missed optimization by the compiler?
4142, 901F:0782  mov  [0A28],ax
4143, 901F:0785  mov  ax,[0A28]
Second, this array of 6-byte entries created at DS:0EDE. Your guess is as good as mine. GPT blabbers about a “table-filling prologue for a segmented memory manager”.
00032be 0ee4 ffff ffff 0eea ffff ffff 0ef0 ffff
00032ce ffff 0ef6 ffff ffff 0efc ffff ffff 0f02
00032de ffff ffff 0f08 ffff ffff 0f0e ffff ffff
00032ee 0f14 ffff ffff 0f1a ffff ffff 0f20 ffff
00032fe ffff 0f26 ffff ffff 0f2c ffff ffff 0f32
000330e ffff ffff 0f38 ffff ffff 0f3e ffff ffff
000331e 0f44 ffff ffff 0f4a ffff ffff 0f50 ffff
000332e ffff 0000 ffff ffff 0ede 0000 0000 0000
Cycles 4549–4571 copy the const data of the program (in our case, the “Hello, world!” string) into DS:1850. Interestingly, a sort of C++ string like structure is created: first the size, 0x0D bytes, then the internal pointer to the buffer, 0x185A, then, at DS:185A, the string itself.
00003c30  00 00 00 00 00 00 0d 00  5a 18 48 65 6c 6c 6f 2c  |........Z.Hello,|
00003c40  20 77 6f 72 6c 64 21 00  00 00 00 00 00 00 00 00  | world!.........|
After some other byte copies, finally, a more enjoyable phase starts from cycle 4595.
The interrupt party
I mentioned before that interrupts make me enjoy the dynamic analysis more, so I was quite happy with seeing a section where they are called often. Having finally configured the memory to its taste, BRUN starts to interact with the rest of the system. In the next 1000 cycles, interrupts and in / out instructions are used to
- Query the DOS version, again (cycle 4609).
- Disable Ctrl-Break (cycle 5092).
- Hook interrupts 0x0 (Divide by zero), 0x4 (Overflow trap) and 0x24 (Critical Error Handler) (cycles 5132, 5139, 5146).
- Read and store the video configuration (cycles 5198, 5342, 5373).
- Unmask
INT 2, the interrupt of the cascade line of the PIC (cycles 5259–5263)
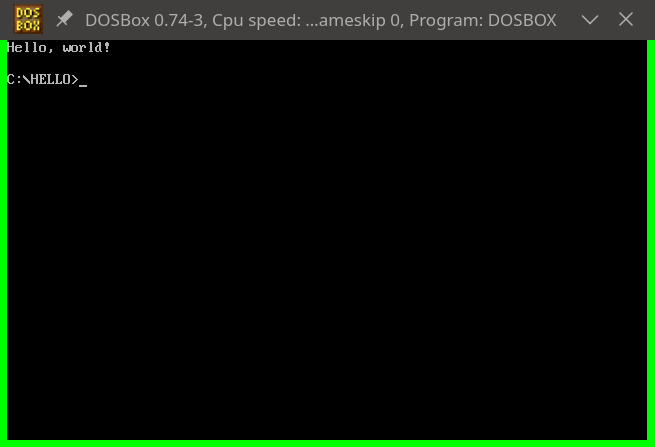
Most importantly, after so much work behind closed curtains, we finally get to see some user-visible effect. BRUN calls the interrupts to blank the screen, set cursor position and define cursor shape at cycles 5496, 5525 and 5562, creating an empty screen with an underline cursor in the top-left corner: how exciting!
On top of that, at cycle 5738, it issues the first printing command: a line of empty spaces in the blank screen. No screenshot this time: you’ll have to believe me. It was the first of the “write character” interrupts we saw in the grep output above, and a sign that more interesting screen writes are approaching.
; INT 10,9 - Write Character
; AL = ASCII character to write
; CX = count of characters to write

5738, 901F:20D4  int  10    AX:0920 BX:0007 CX:0050 DX:0119 SI:0060 DI:0A3D BP:1B6E SP:1B40 DS:023E ES:023E
Other interactions with OS and BIOS follow:
- The “palette registers” are set, to make sure we get white text on black background (cycle 5929).
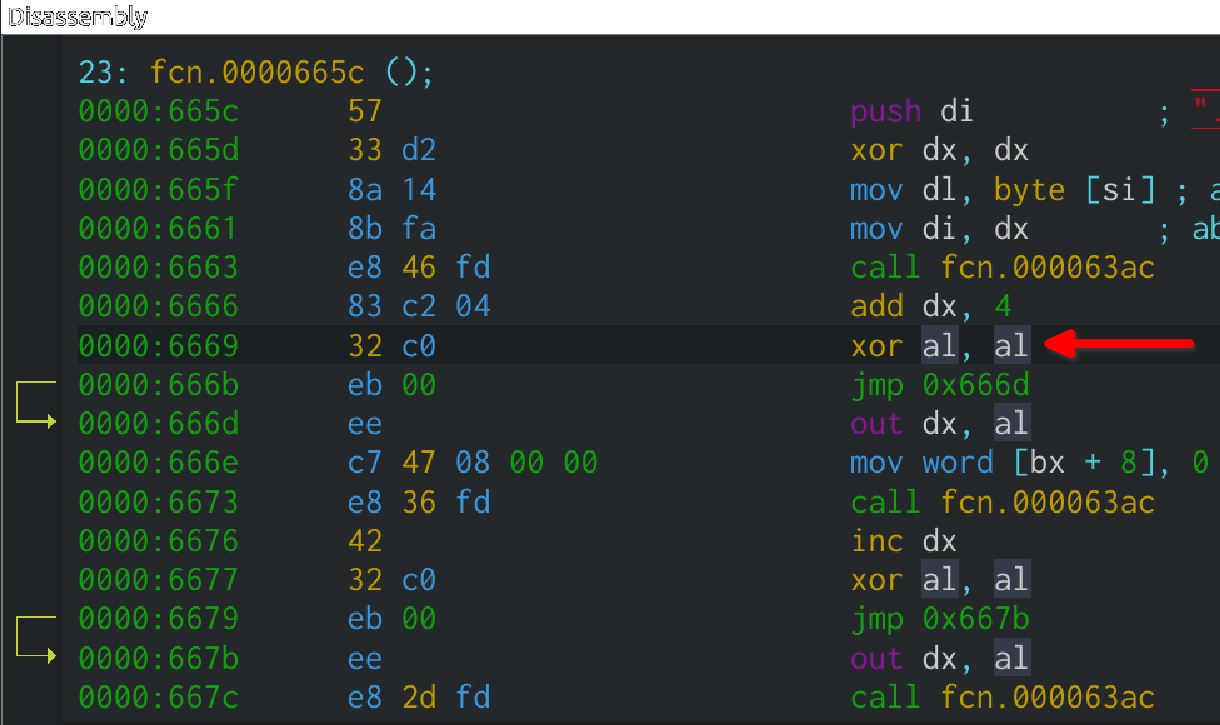
- The PC speaker is disabled (cycles 5962 – 5965). But look at the code: just like a little kid, BRUN makes a jump on the spot. The LLM insists it's a timing technique, but other software seems to work perfectly fine without that.
5962, 901F:2F36  in   al,61           AX:0000 BX:0AD6 CX:0019 DX:0101 SI:0060 DI:0A3D BP:1B6E SP:1B5A DS:023E ES:023E
5963, 901F:2F38  and  al,FC           AX:0030 BX:0AD6 CX:0019 DX:0101 SI:0060 DI:0A3D BP:1B6E SP:1B5A DS:023E ES:023E
5964, 901F:2F3A  jmp  00002F3C ($+0)  AX:0030 BX:0AD6 CX:0019 DX:0101 SI:0060 DI:0A3D BP:1B6E SP:1B5A DS:023E ES:023E
5965, 901F:2F3C  out  61,al           AX:0030 BX:0AD6 CX:0019 DX:0101 SI:0060 DI:0A3D BP:1B6E SP:1B5A DS:023E ES:023E
- The counter of the system timer is reset (cycles 5982–5985).
- The network equipment is scanned (cycle 6001). This uses interrupt 2A,0 which is extremely poorly documented. Even ChatGPT had to hallucinate some details to pad its token count. Also, for the third time the program checks the DOS version.
I have glossed over a lot of details that explain why the “interrupt party” lasted so long. To just give an example, BRUN made a lot of calculations with the cursor position before deciding that, at the end of the day, (0, 0) is an acceptable starting location. In general, it really seemed to worry about exotic hardware and system conditions that I, user of a bog-standard DOSBox-emulated machine, can hardly envision.
Cycles 6008–6190 are other preparations. I did not take the time to figure out all the details, but they seem to fill some variables in the data segment based on the various information collected by querying the hardware. All this is not very important compared to what follows. Time for a last memory snapshot:

This is just decorative, none of these details are going to matter.
This chapter is almost over, and the music shifts:
6191, 901F:0608  pop  ax         AX:0005 BX:0300 CX:0000 DX:0101 SI:0001 DI:0A3D BP:1B6E SP:1B64 DS:023E ES:023E
6192, 901F:0609  test al,01      AX:0088 BX:0300 CX:0000 DX:0101 SI:0001 DI:0A3D BP:1B6E SP:1B66 DS:023E ES:023E
6193, 901F:060B  je   00000612   AX:0088 BX:0300 CX:0000 DX:0101 SI:0001 DI:0A3D BP:1B6E SP:1B66 DS:023E ES:023E
6194, 901F:0612  test ah,0C      AX:0088 BX:0300 CX:0000 DX:0101 SI:0001 DI:0A3D BP:1B6E SP:1B66 DS:023E ES:023E
6195, 901F:0615  je   0000061C   AX:0088 BX:0300 CX:0000 DX:0101 SI:0001 DI:0A3D BP:1B6E SP:1B66 DS:023E ES:023E
BRUN pops the value 0x88. This bitfield, coming from the binary image of HELLO.EXE, is not so important as the fact that now most of the stack has been unwound. At its top lies now that address, 01F4:0030, that HELLO.EXE had pushed at cycle 3274. And we are about to jump right there:
6196, 901F:061C retf AX:0088 BX:0300 CX:0000 DX:0101 SI:0001 DI:0A3D BP:1B6E SP:1B66 DS:023E ES:023E
Following the trace, part 3: the bytecode, finally
cd is not only to change directory
We are back in HELLO.EXE. And here, at 01F4:0030, lies the “compiled” BASIC program. We found it at last!
00001f70 cd 3f bc bb 56 18 cd 3f 6e cd 3e 79 cd 3e 02 00 |.?..V..?n.>y.>..|
But no disassembler would understand it without some help, because its format is very strange. For the sake of clarity I will decode it in advance:
01F4:0030   cd 3f    ; int 3f: BRUN runtime
01F4:0032   bc       ; opcode
01F4:0033   bb 56 18 ; mov bx, 0x1856
01F4:0036   cd 3f    ; int 3f: BRUN runtime
01F4:0038   6e       ; opcode
01F4:0039   cd 3e    ; int 3e: BRUN runtime
01F4:003B   79       ; opcode
01F4:003C   cd 3e    ; int 3e: BRUN runtime
01F4:003E   02       ; opcode
This is assembly, but mixed with data; how is the processor supposed to execute it? The solution is soon revealed by looking at the first invocation of interrupt 3F, which was hooked by BRUN…
6197, 01F4:0030 int 3F AX:0088 BX:0300 CX:0000 DX:0101 SI:0001 DI:0A3D BP:1B6E SP:1B6A DS:023E ES:023E
In the interrupt handler, BRUN manipulates the call stack so that, when we return in the user code, the opcode will be skipped!
6200, 901F:00F3  pop  bx   AX:0088 BX:0300 CX:0000 DX:0101 SI:0001 DI:0A3D BP:1B6E SP:1B64 DS:023E ES:023E
6201, 901F:00F4  pop  ds   AX:0088 BX:0032 CX:0000 DX:0101 SI:0001 DI:0A3D BP:1B6E SP:1B66 DS:023E ES:023E
6202, 901F:00F5  popf      AX:0088 BX:0032 CX:0000 DX:0101 SI:0001 DI:0A3D BP:1B6E SP:1B68 DS:01F4 ES:023E
6203, 901F:00F6  push ds   AX:0088 BX:0032 CX:0000 DX:0101 SI:0001 DI:0A3D BP:1B6E SP:1B6A DS:01F4 ES:023E
6204, 901F:00F7  inc  bx   AX:0088 BX:0032 CX:0000 DX:0101 SI:0001 DI:0A3D BP:1B6E SP:1B68 DS:01F4 ES:023E
6205, 901F:00F8  push bx   AX:0088 BX:0033 CX:0000 DX:0101 SI:0001 DI:0A3D BP:1B6E SP:1B68 DS:01F4 ES:023E
The opcode itself is used as index into an array of callbacks located at CS:038D. We jump into the selected callback, again abusing the ret instruction:
6206, 901F:00F9  mov  bl,[bx-01]          AX:0088 BX:0033 CX:0000 DX:0101 SI:0001 DI:0A3D BP:1B6E SP:1B66 DS:01F4 ES:023E
6207, 901F:00FC  xor  bh,bh               AX:0088 BX:00BC CX:0000 DX:0101 SI:0001 DI:0A3D BP:1B6E SP:1B66 DS:01F4 ES:023E
6208, 901F:00FE  shl  bx,1                AX:0088 BX:00BC CX:0000 DX:0101 SI:0001 DI:0A3D BP:1B6E SP:1B66 DS:01F4 ES:023E
6209, 901F:0100  push word cs:[bx+038D]   AX:0088 BX:0178 CX:0000 DX:0101 SI:0001 DI:0A3D BP:1B6E SP:1B66 DS:01F4 ES:023E
...
6214, 901F:0116  ret                      AX:0088 BX:0300 CX:0000 DX:0101 SI:0001 DI:0A3D BP:1B6E SP:1B64 DS:023E ES:023E
Most of the pieces are now been revealed. Behind the interrupt 3F handler lies the opcode dispatcher. By examining the callbacks in the table at CS:038D we could find out what each opcode means. But decoding all of them would be a project on its own, so let’s just follow those of the PRINT instruction: the first one is BC, whose handler is at 901F:9B6D.4
This handler is quite small (cycles 6215–6233): it reads this array of 7 callbacks from the data area:
023E:03B0 4D 62 50 62 4F DA 0E 5F 9B DA 9D DA 0D DB
It copies it into another hard-coded location of the data segment, DS:0EBA, then it returns.
A long-awaited message
The second opcode, 6E, is the big one.
6234, 01F4:0033  mov  bx,1856   AX:0088 BX:0300 CX:0000 DX:0101 SI:0001 DI:0A3D BP:1B6E SP:1B6A DS:023E ES:023E
6235, 01F4:0036  int  3F        AX:0088 BX:1856 CX:0000 DX:0101 SI:0001 DI:0A3D BP:1B6E SP:1B6A DS:023E ES:023E
Register BX is loaded with the value 1856. This is a pointer: if you look just before the section “The interrupt party”, you will see that this is the offset there the std::string-like structure containing “Hello, world!” is located.
The callback for 6E is 901F:99C7 and it does a lot of work. I can understand that: we are in the simplest case for a PRINT instruction – cursor at the corner of a blank screen, text mode, standard PC – but the function does not know that, and must take into account all eventualities: how many columns has the screen? Does the text fit on one line? If not, do we need to scroll? Are we printing strings, integers or decimal numbers?
I can therefore surmise that the previously defined array of seven callbacks is used to gain some flexibility in handling this. The handler uses three of the callbacks in the array. Those at indexes 1 and 0 are very short, just returning the cursor row and column. Then the function at index 4 (DS:0EC2) is invoked, which is huge. It loads address and size of the string to print into SI and CX:
6299, 901F:9A48  call near word [0EC2]   AX:000D BX:1856 CX:5000 DX:0101 SI:99CC DI:0A3D BP:1B6E SP:1B56 DS:023E ES:023E
6300, 901F:DA9B  mov  cx,[bx]            AX:000D BX:1856 CX:5000 DX:0101 SI:99CC DI:0A3D BP:1B6E SP:1B54 DS:023E ES:023E
6301, 901F:DA9D  jcxz 0000DB13 ($+74)    AX:000D BX:1856 CX:000D DX:0101 SI:99CC DI:0A3D BP:1B6E SP:1B54 DS:023E ES:023E
6302, 901F:DA9F  mov  si,[bx+02]         AX:000D BX:1856 CX:000D DX:0101 SI:99CC DI:0A3D BP:1B6E SP:1B54 DS:023E ES:023E
6303, 901F:DAA2  mov  word [0A3A],0000   AX:000D BX:1856 CX:000D DX:0101 SI:185A DI:0A3D BP:1B6E SP:1B54 DS:023E ES:023E
Then (cycles 6304–6390) it performs a lot of checks: calculation that the string fits in a row considering cursor position and screen width, check that all characters are printable, text color selection and adjustments based on the video mode (text or graphics).
And it starts to print the string… very slowly… one byte at a time. The character is loaded in AL…
6391, 901F:278A  lodsb            AX:000D BX:0007 CX:000D DX:0000 SI:185A DI:0A3D BP:1B6E SP:1B4A DS:023E ES:023E
6392, 901F:278B  push cx          AX:0048 BX:0007 CX:000D DX:0000 SI:185B DI:0A3D BP:1B6E SP:1B4A DS:023E ES:023E
6393, 901F:278C  mov  cx,0001     AX:0048 BX:0007 CX:000D DX:0000 SI:185B DI:0A3D BP:1B6E SP:1B48 DS:023E ES:023E
Then the BIOS function “print one character” is called, through a wrapper that makes it very safe, and also burns some more processor cycles. Anyway, at cycle 6400, an “H” finally appears on the screen. A pity DOSBox does not let us see it. But nothing prevents us from imagining it…
6394, 901F:278F  mov  ah,09       AX:0048 BX:0007 CX:0001 DX:0000 SI:185B DI:0A3D BP:1B6E SP:1B48 DS:023E ES:023E
6395, 901F:2791  call 000020D1    AX:0948 BX:0007 CX:0001 DX:0000 SI:185B DI:0A3D BP:1B6E SP:1B48 DS:023E ES:023E
6396, 901F:20D1  push bp          AX:0948 BX:0007 CX:0001 DX:0000 SI:185B DI:0A3D BP:1B6E SP:1B46 DS:023E ES:023E
6397, 901F:20D2  push si          AX:0948 BX:0007 CX:0001 DX:0000 SI:185B DI:0A3D BP:1B6E SP:1B44 DS:023E ES:023E
6398, 901F:20D3  push di          AX:0948 BX:0007 CX:0001 DX:0000 SI:185B DI:0A3D BP:1B6E SP:1B42 DS:023E ES:023E
6399, 901F:20D4  int  10          AX:0948 BX:0007 CX:0001 DX:0000 SI:185B DI:0A3D BP:1B6E SP:1B40 DS:023E ES:023E
6400, F000:1320  callback 0019    AX:0948 BX:0007 CX:0001 DX:0000 SI:185B DI:0A3D BP:1B6E SP:1B3A DS:023E ES:023E
6401, F000:1324  iret             AX:0948 BX:0007 CX:0001 DX:0000 SI:185B DI:0A3D BP:1B6E SP:1B3A DS:023E ES:023E
6402, 901F:20D6  pop  di          AX:0948 BX:0007 CX:0001 DX:0000 SI:185B DI:0A3D BP:1B6E SP:1B40 DS:023E ES:023E
6403, 901F:20D7  pop  si          AX:0948 BX:0007 CX:0001 DX:0000 SI:185B DI:0A3D BP:1B6E SP:1B42 DS:023E ES:023E
6404, 901F:20D8  pop  bp          AX:0948 BX:0007 CX:0001 DX:0000 SI:185B DI:0A3D BP:1B6E SP:1B44 DS:023E ES:023E
6405, 901F:20D9  ret              AX:0948 BX:0007 CX:0001 DX:0000 SI:185B DI:0A3D BP:1B6E SP:1B46 DS:023E ES:023E
Since “print one character” does not move the cursor, the handler must move it itself, through another interrupt call wrapped in another packaging of pushes and pops. There is why the procedure takes 30 cycles per character! Note that the BIOS does have a function for printing a string in one go, and that we could also copy the bytes directly in video memory. But BRUN seems to always follow the most general, and slowest, route.
6406, 901F:2794  inc  dl          AX:0948 BX:0007 CX:0001 DX:0000 SI:185B DI:0A3D BP:1B6E SP:1B48 DS:023E ES:023E
6407, 901F:2796  mov  ah,02       AX:0948 BX:0007 CX:0001 DX:0001 SI:185B DI:0A3D BP:1B6E SP:1B48 DS:023E ES:023E
6408, 901F:2798  call 000020D1    AX:0248 BX:0007 CX:0001 DX:0001 SI:185B DI:0A3D BP:1B6E SP:1B48 DS:023E ES:023E
6409, 901F:20D1  push bp          AX:0248 BX:0007 CX:0001 DX:0001 SI:185B DI:0A3D BP:1B6E SP:1B46 DS:023E ES:023E
6410, 901F:20D2  push si          AX:0248 BX:0007 CX:0001 DX:0001 SI:185B DI:0A3D BP:1B6E SP:1B44 DS:023E ES:023E
6411, 901F:20D3  push di          AX:0248 BX:0007 CX:0001 DX:0001 SI:185B DI:0A3D BP:1B6E SP:1B42 DS:023E ES:023E
6412, 901F:20D4  int  10          AX:0248 BX:0007 CX:0001 DX:0001 SI:185B DI:0A3D BP:1B6E SP:1B40 DS:023E ES:023E
6413, F000:1320  callback 0019    AX:0248 BX:0007 CX:0001 DX:0001 SI:185B DI:0A3D BP:1B6E SP:1B3A DS:023E ES:023E
6414, F000:1324  iret             AX:0248 BX:0007 CX:0001 DX:0001 SI:185B DI:0A3D BP:1B6E SP:1B3A DS:023E ES:023E
6415, 901F:20D6  pop  di          AX:0248 BX:0007 CX:0001 DX:0001 SI:185B DI:0A3D BP:1B6E SP:1B40 DS:023E ES:023E
6416, 901F:20D7  pop  si          AX:0248 BX:0007 CX:0001 DX:0001 SI:185B DI:0A3D BP:1B6E SP:1B42 DS:023E ES:023E
6417, 901F:20D8  pop  bp          AX:0248 BX:0007 CX:0001 DX:0001 SI:185B DI:0A3D BP:1B6E SP:1B44 DS:023E ES:023E
6418, 901F:20D9  ret              AX:0248 BX:0007 CX:0001 DX:0001 SI:185B DI:0A3D BP:1B6E SP:1B46 DS:023E ES:023E
6419, 901F:279B  pop  cx          AX:0248 BX:0007 CX:0001 DX:0001 SI:185B DI:0A3D BP:1B6E SP:1B48 DS:023E ES:023E
We loop back and repeat 13 times, one per each glyph:
6420, 901F:279C loop 0000278A AX:0248 BX:0007 CX:000D DX:0001 SI:185B DI:0A3D BP:1B6E SP:1B4A DS:023E ES:023E
The handler runs till cycle 6833, when it returns to HELLO.EXE’s bytecode.
Nothing user-visible happens after this point. And yet, two opcodes (half of the total!) remain to be processed, and we are still more than 1000 assembly statements away from the DOS prompt. A conscientious reverse engineer would document what happens next: I suppose the runtime will unwind the massive construction it has built up. But, honestly? I’ve had enough, and I hope the same applies to you, my reader. Let’s just skip to the end, shall we?
; INT 21,4C - Terminate Process
; AL = Return Code

7904, 901F:0651  int  21   AX:4C00 BX:E987 CX:0706 DX:0000 SI:0001 DI:0A3D BP:1B6E SP:1B66 DS:023E ES:023E
Conclusions
TL;DR
After this long ride, let’s summarize what happens when HELLO.EXE (or any QB30-compiled program) is started:
HELLO.EXE:
- Formats the memory into various regions by placing custom control blocks.
- Loads the code of
BRUN30.EXE, as close to the end of the conventional memory as possible. - Loads another section of
BRUN30in the data segment, overwriting most of its own startup code. - Jumps into BRUN’s entry point.
BRUN30.EXE:
- After receiving control, completes the setup of the memory regions.
- Scans the hardware, especially the video.
- Hooks up various interrupts, notably 3F and 3E.
- Jumps to
HELLO’s bytecode, located near the start of the data segment.
Bytecode execution:
- The bytecode is a sequence of calls to interrupts
3Fand3E, which invoke BRUN’s handlers. - Each call is followed by a byte representing an opcode. The interrupt handler manipulates the return address so that the opcode does not get executed.
- An additional parameter can be passed through register
BX.
Also we discovered that a PRINT command is compiled into opcodes BC (preparation) and 6E (execution).
This project did not result in fancy mods, but you can download HELLO.EXE, the execution trace and some (unpolished) reversing notes in case you would like to continue the work.
Next steps?
I checked Insects to confirm these findings and was glad to find out that the bytecode is in a similar place (offset 0x243 in INSECTS.EXE, compared to 0x240 in HELLO.EXE). The structure is now easy to understand; here the first bytes:
cd 3e 5b ; opcode 5B
90 90    ; 2x NOP
bb ff ff ; mov bx, 0xffff
cd 3e 32 ; opcode 32
90 90    ; 2x NOP
Other questions arise. How much effort is needed to reverse engineer enough opcodes to understand this game? Could we, in reasonable time, decode all possible opcodes and build a QB30 decompiler for arbitrary programs? And why are the instructions of Insects padded with NOPs?
I have yet to decide whether to continue to dissect this particular piece of computer history, or to focus on different projects. It would have been fun to analyze Aids Info Disk, the first ransomware ever, which was written using QB30. But, unfortunately, its binary was compiled to link against BCOM30.LIB, not BRUN30.EXE, and its structure appears to be completely different.
Anyway, for this time I think it’s enough. I hope that you enjoyed the reading. See you next time!